
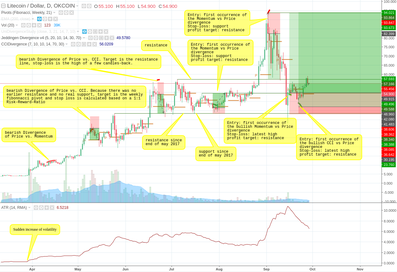
On March 29th a sudden Increase of Volatility happend - look at the Average True Range (ATR): this Indicator clearly shows that the daily Range of Price started to increase.
Several Divergences indicate a Reversal of the current trend. Divergences of the Commodity Channel Index ( CCI ) against Price are shown by CCIDivergence, Divergences of Momentum against Price are shown by "Jeddingen Divergence" (JDiv).
Based on those both Indicators Jeddingen Divergence and CCIDivergence, a lucrative Strategy evolves, looking at the daily Candles.
A Signal is generated when a JDiv or a CCIDiv is occurs, Support and Resistance lines can be used as Take-Profit and Stop-Loss.
In this Example, there is one Exceptions. The very first Divergence wouldn't have worked out - although Price dropped at the End of the Divergence. Maybe Volatility/ ATR was too low.
At the second Divergence (the first Trade), there was a bearish CCIDivergence with no Resistance (Price was at it's alltime high at that time) and no support Level that seemed usable (it would have been a Support somewhere at the low-volatility Area). A common Practice with those kind of Trades is to use Pivots as Profit-Targets. In this case the weekly Pivot (Fibonacci-Style) would have been a good Target. Most of my Trades do not have a Stop-Loss, but in this case, I guess I would have calculated the Stop-Loss in a Way so that the Risk-Reward-Ration would have been 1.
Recently there appeared a JDiv and a CCIDiv. According to my Strategy, the Profit-Target could be the alltime High at 94.021. Though there are other structures since September second, I don't believe that they are reliable resistance Levels, because since then, LTCUSD was in a massive Downtrend. But to play it safe, an earlier Exit could be considered, e.g. an earlier Pivot or a Fibonacci Level.
As Stop-Loss I would suggest the Resistance-Level that was used in the earlier Trades.
To learn more about my Indicators and Strategies, please check the Indicator Section.
Here is the Link to the analysis at TradingView: www.tradingview.com/chart/K2kjB4VO/